How to Calculate BEP for Your Business:
When will I be able to break even? It's one of the most important questions to consider when beginning a business. That's why a break-even analysis is so important: it helps you determine fixed costs (like rent) and variable costs (like materials) so you can accurately set your prices and forecast when your business will become profitable.
The concept of the break-even point is central to the break-even analysis (BEP).
TAKEAWAYS IMPORTANT
- The breakeven point is calculated in accounting by dividing fixed costs of production by price per unit minus variable costs of production.
- The breakeven point for a product is the point at which the expenses of production equal the revenues.
- When the market price of an asset equals its original cost, it is considered to have reached the breakeven point in investment.
What is the break-even point for a business?
Definition: The break-even point of a firm is when revenues equal costs. Once you have that amount, you should examine all of your costs, including rent, labor, and materials, as well as your pricing structure.
Then consider the following questions: Is it possible to reach your break-even point in a reasonable amount of time if your pricing is too low or your costs are too high? Is your company long-term viable?
How to calculate your break-even point
There are a few simple break-even point formulas that might assist you in calculating your business's break-even threshold. The first is based on the number of product units sold, while the second is based on points in sales dollars. Here's how to figure out your break-even point:
How to figure out your break-even point using units: Subtract the variable cost per unit from the fixed cost per unit. Fixed costs are those that remain constant regardless of how many units are sold. The revenue is the price at which you sell the product less variable costs such as labor and materials.
Break-Even Point (Units) = Fixed Costs ÷ (Revenue per Unit – Variable Cost per Unit)
When calculating a break-even point based on sales dollars, keep the following in mind: Subtract the contribution margin from the fixed costs. The contribution margin is calculated by deducting variable costs from a product's price. This sum is subsequently applied to the fixed costs.
Break-Even Point (sales dollars) = Fixed Costs ÷ Contribution Margin
Contribution Margin = Price of Product – Variable Costs
Let's take a closer look at the formula components to have a better understanding of what this all implies.
- Fixed costs: Fixed costs, such as rent paid for storefronts or production facilities, computers, and software, are unaffected by the number of things sold, as previously stated. Fixed costs also include fees paid for services like graphic design, advertising, and public relations.
- Contribution margin: The contribution margin is computed by deducting the variable costs of an item from the selling price. The contribution margin is $60 if you sell a product for $100 and the cost of materials and labor is $40. The $60 is then used to cover the fixed costs, and any money left over is your net profit.
- Contribution margin ratio: Subtract your fixed costs from your contribution margin to get this figure, which is commonly stated as a percentage. You may then figure out what you need to do to break even, such as lowering production costs or raising prices.
- Profit earned after you've broken even: You've reached break-even when your revenues equal your fixed and variable costs, and the company will declare a net profit or loss of $0. Any sales you make after that go toward your net profit.
How to use a break-even analysis
You can determine your break-even point using break-even analysis. But your computations aren't finished yet. When you do the math, you may discover that you need to sell a lot more things than you thought to break even.
At this stage, you must decide whether your existing strategy is feasible, or whether you need to boost pricing, cut costs, or do both. You should also think about how successful your products will be on the market. There's no guarantee that the number of things you need to sell will sell because the break-even analysis determines how many you need to sell.
This financial analysis should ideally be completed before you start a firm so that you are aware of the risks involved. To put it another way, you should determine whether the business is worthwhile. Existing firms should use this approach to determine whether the anticipated return is worth the initial costs before introducing a new product or service.
Break-even analysis examples
A break-even analysis is useful for more than simply startup planning. Here are some examples of how companies might include it in their daily operations and planning.
- Prices: If your study shows that your present price is too low to break even in the timeframe you want, you may choose to increase the item's cost. However, always be sure to compare the prices of similar things to avoid pricing yourself out of the market.
- Materials: Are labor and material costs unsustainable? Investigate how you may keep your desired level of quality while cutting expenditures.
- New goods include: Consider both the new variable expenses and the fixed costs, such as design and promotion fees, before launching a new product.
- Planning: Setting longer-term goals is easier when you know exactly how much you need to make. If you wish to grow your business and move into a larger space with a higher rent, for example, you can figure out how much more you need to sell to meet the increased fixed costs.
- Goals: Knowing how many units you need to sell or how much money you need to make to break even can be a great motivator for you and your team.
Business Breakeven Points
The breakeven formula for a firm calculates the amount of money required to break even. The contribution margin can be used to convert this into units (unit sale price less variable costs). The number of units required to break-even is calculated by dividing the fixed costs by the contribution margin.
Business Breakeven=Gross Profit MarginFixed Costs
The financial statements of a company contain the information needed to determine its BEP. The fixed costs and gross margin percentage are the initial pieces of information that must be provided.
Assume a corporation with $1 million in fixed costs and a 37 percent gross margin. It costs $2.7 million to break even ($1 million / 0.37). To pay its fixed and variable costs, the corporation must generate $2.7 million in revenue in this breakeven point example. The corporation will make money if it creates more sales. There will be a loss if it generates fewer sales.
It's also feasible to figure out how many units must be sold to cover fixed costs, allowing the company to break even. Calculate to accomplish this.
Assume a company's product has a $50 sale price and $10 in variable costs. ($50 - $10) is the contribution margin. To figure out how many units the company needs to sell, multiply the fixed costs by the contribution margin: $1 million divided by $40 equals 25,000 units. The corporation will make a profit if it sells more units than this. There will be a loss if it sells for less.
What Is a Breakeven Point?
The term "breakeven point" is used in a variety of commercial and financial contexts. It is the level of production at which total production revenue equals entire production costs in accounting terms. The breakeven point in investing is the point at which the initial cost equals the current market price. Meanwhile, in options trading, the breakeven point occurs when the market price of an underlying asset hits the threshold at which a buyer will not lose money.
How Do You Calculate a Breakeven Point?
In most cases, fixed costs are divided by the gross profit margin to get the breakeven threshold in business. This yields the amount of money required for a business to break even. When it comes to equities, a trader would have hit the breakeven mark if he acquired stock for $200 and sold it at $200 nine months later after sliding from $250.
Graphically Representing the Break-Even Point
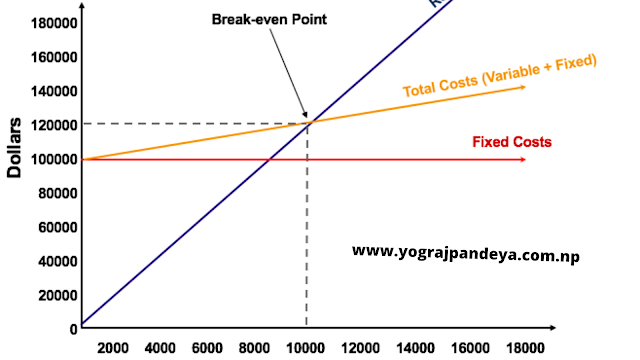
The break-even chart, also known as the Cost Volume Profit (CVP) graph, is a graphical representation of the unit and dollar sales required to break even. The CVP graph for the case above is shown below:
Explanation:
The X-axis (horizontal) represents the number of units, while the Y-axis represents the dollar amount (vertical).
- The $100,000 total fixed costs are represented by the red line.
- The revenue per unit sold is represented by the blue line. Selling 10,000 items, for example, would yield $120,000 in income (10,000 x $12).
- Total costs are represented by the yellow line (fixed and variable costs).
- For example, if the company sells 0 units, it will have $0 in variable expenses but $100,000 in fixed expenditures, totaling $100,000 in costs.
- If the company sells 10,000 units, the variable expenses will be $20,000 and the fixed costs will be $100,000, for a total cost of $120,000.
jihads


